Find the best AI Tools for everything. Browse 5000+ AI tools in 88+ categories.
Read full reviews of a selection of the best AI Tools available.
Get a free AI Tool List with 500+ of the best AI Tools available. And we continue to update it every week.
Free Best Software community of AI enthusiasts and AI resources. Learn how to leverage AI.
Learn how to implement AI a collection of the best AI tutorials.
Weekly AI happenings, AI tools, guides & resources.
Join the FREE AI Community; learn how to use AI, ask questions, network, and get access to AI resources and practical AI lessons.
From beginner to AI expert.
Learn how to use AI with practical AI guides & resources.
Keep up to date with AI news.
Subscribe to the Insidr AI YouTube channel.
Full list of AI conferences and events worldwide.
Open-source dashboard tool for visualizing time-series data.
Best for: DevOps and IT. Grafana connects to Prometheus, SQL databases, and cloud services to create customizable monitoring dashboards.
You must be logged in to post a comment.
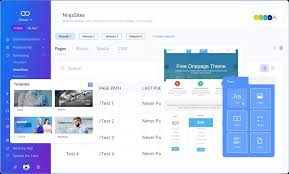
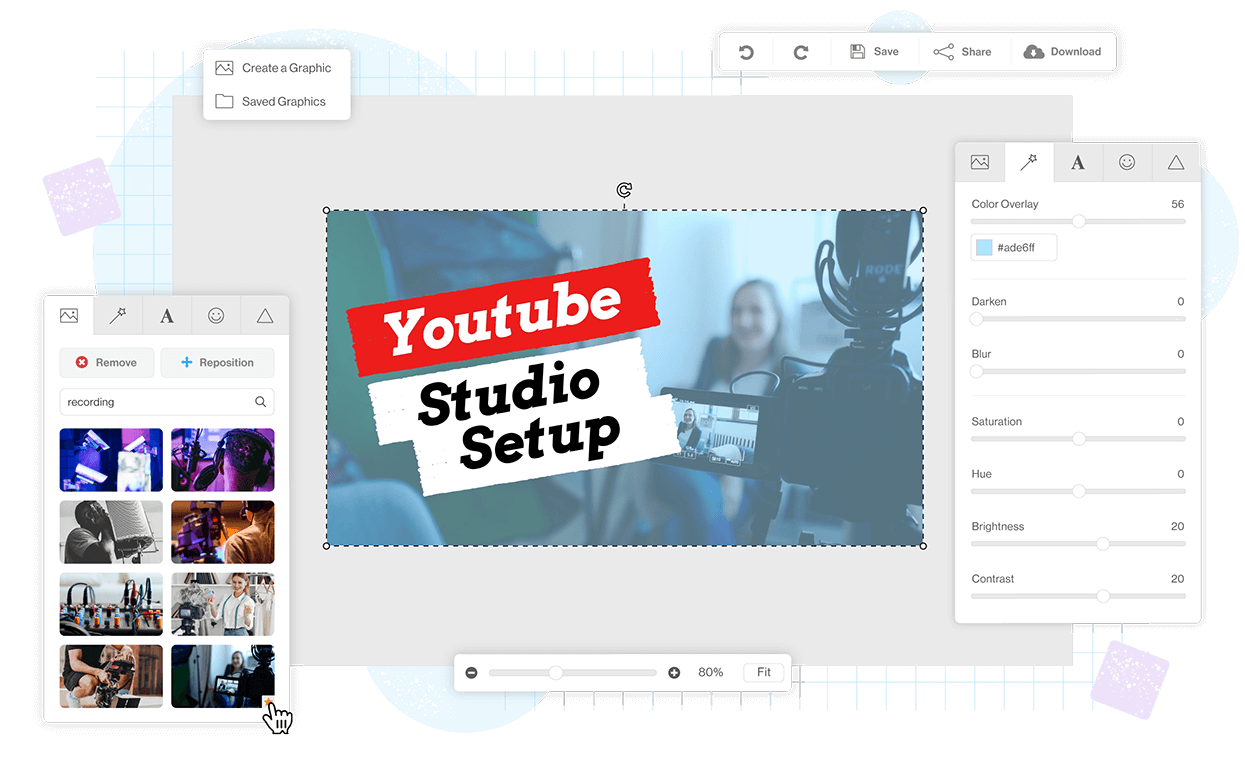
Build beautiful and
Build and engage
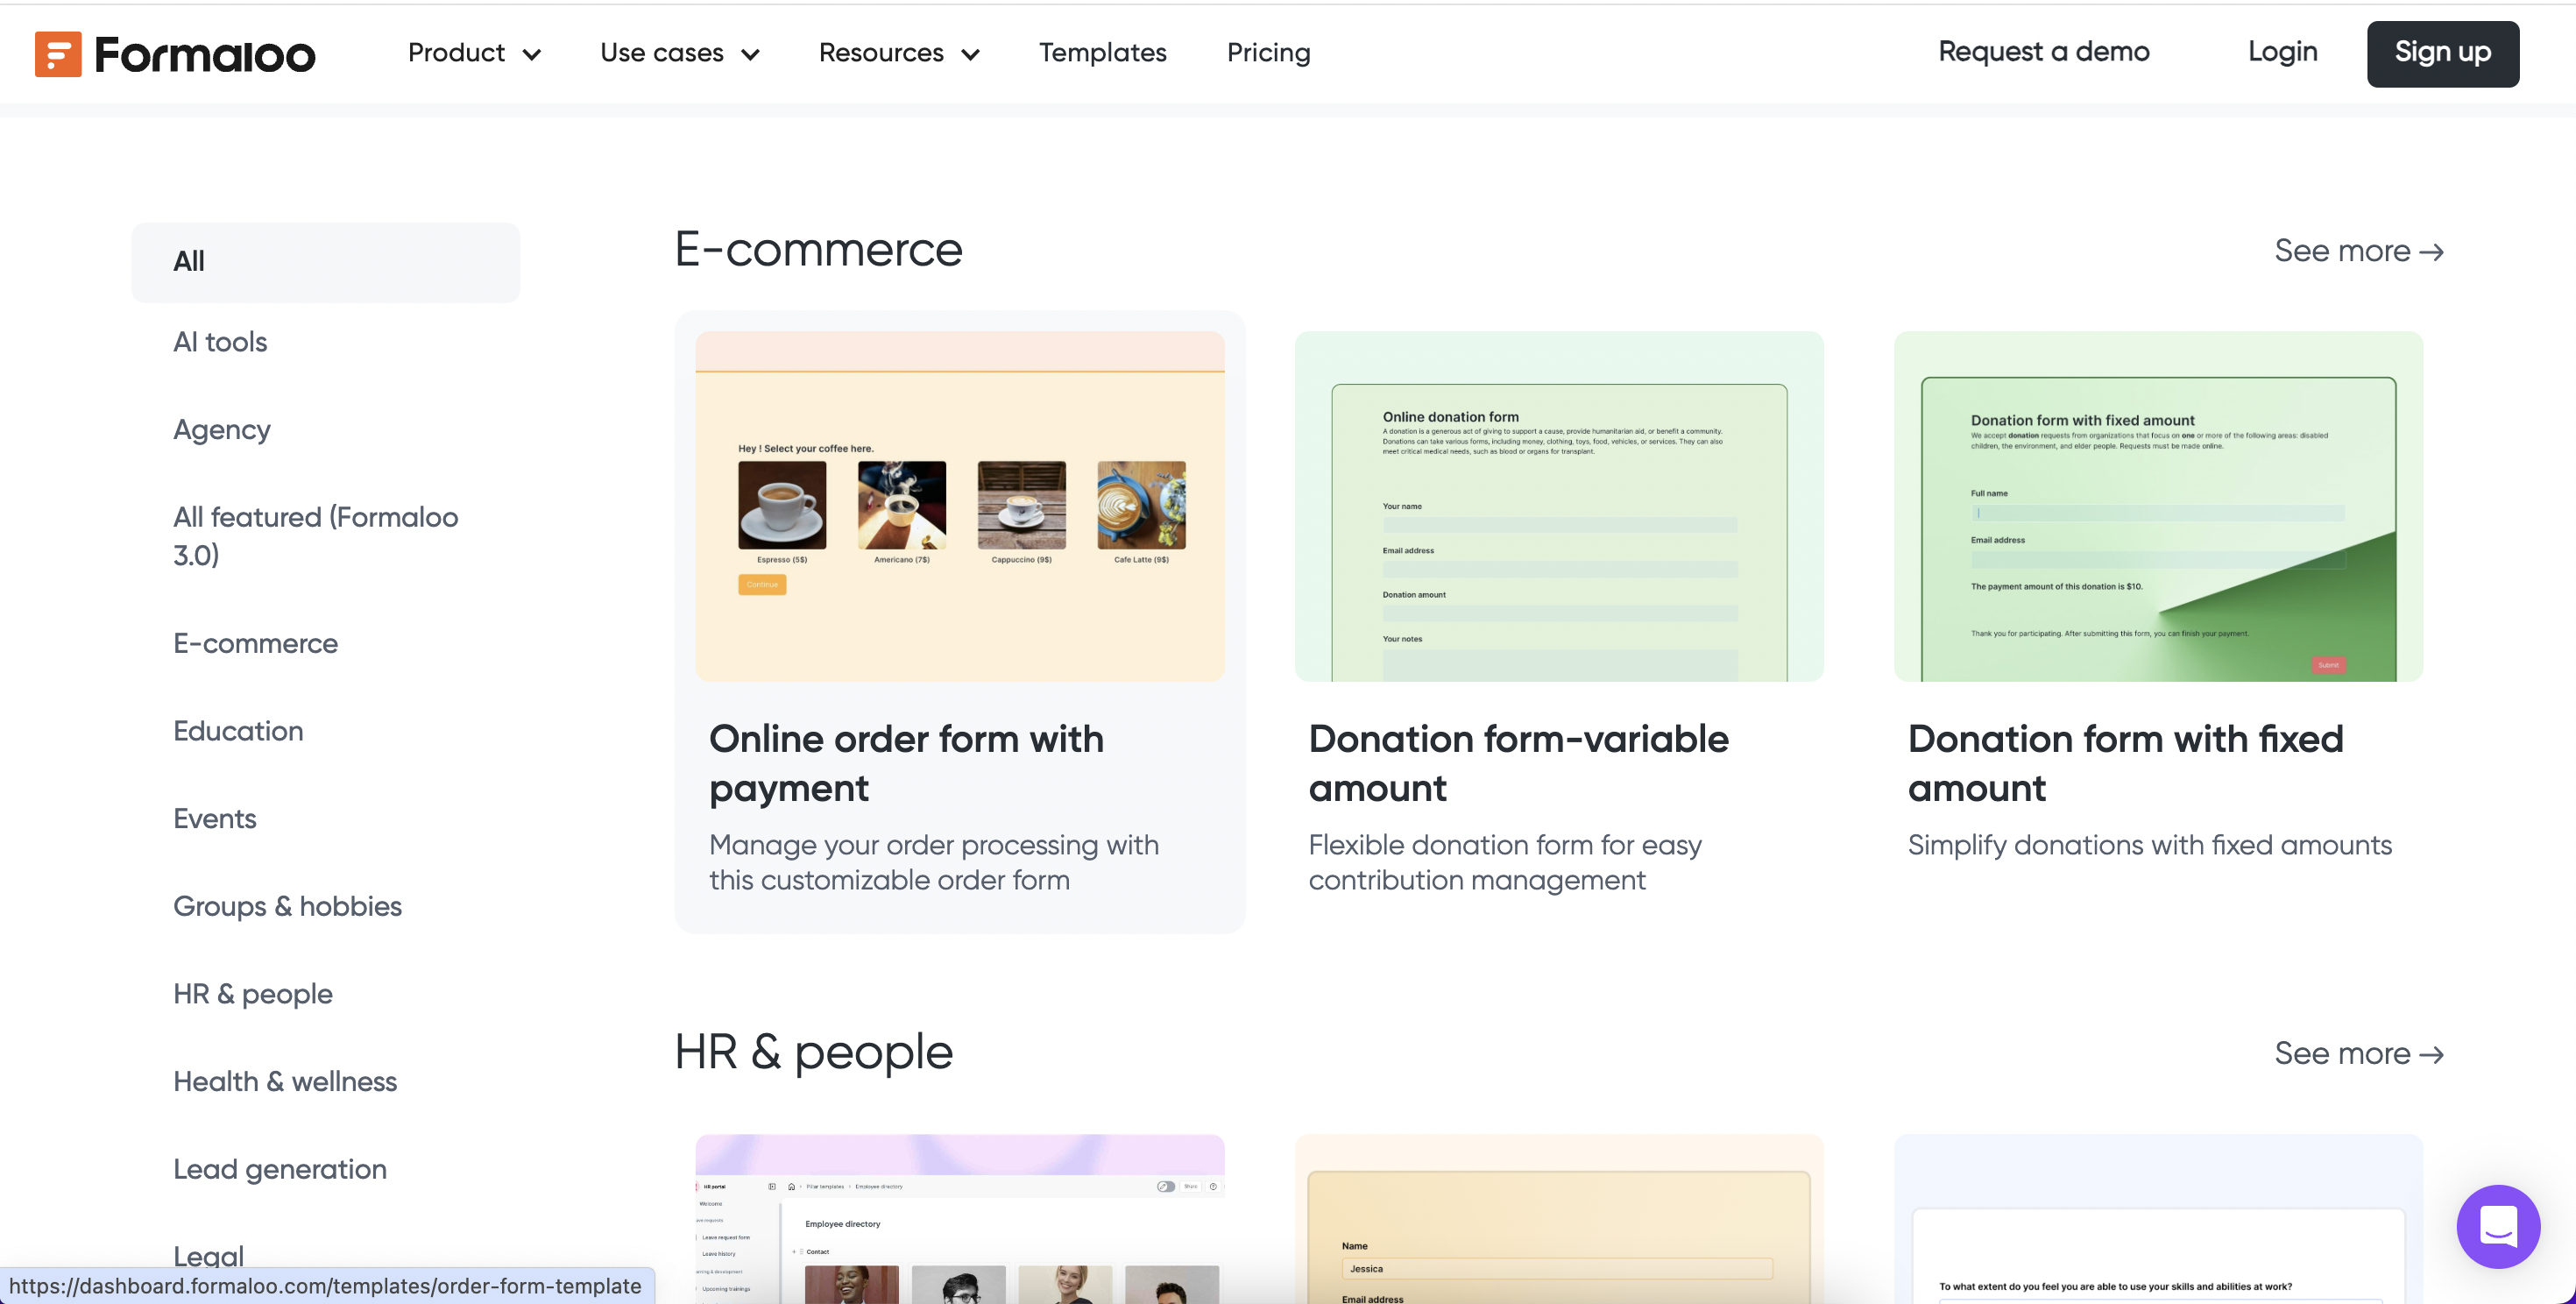
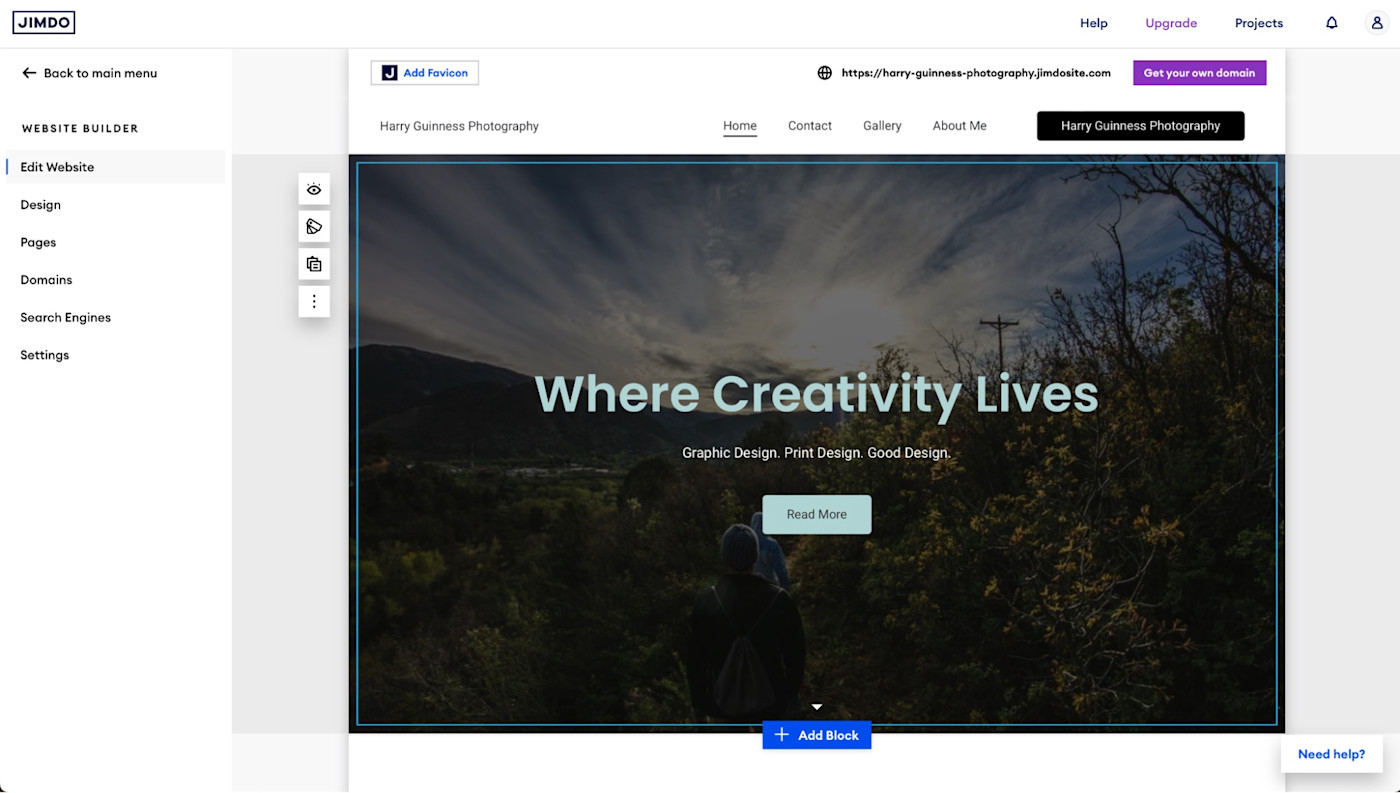
Create and manage
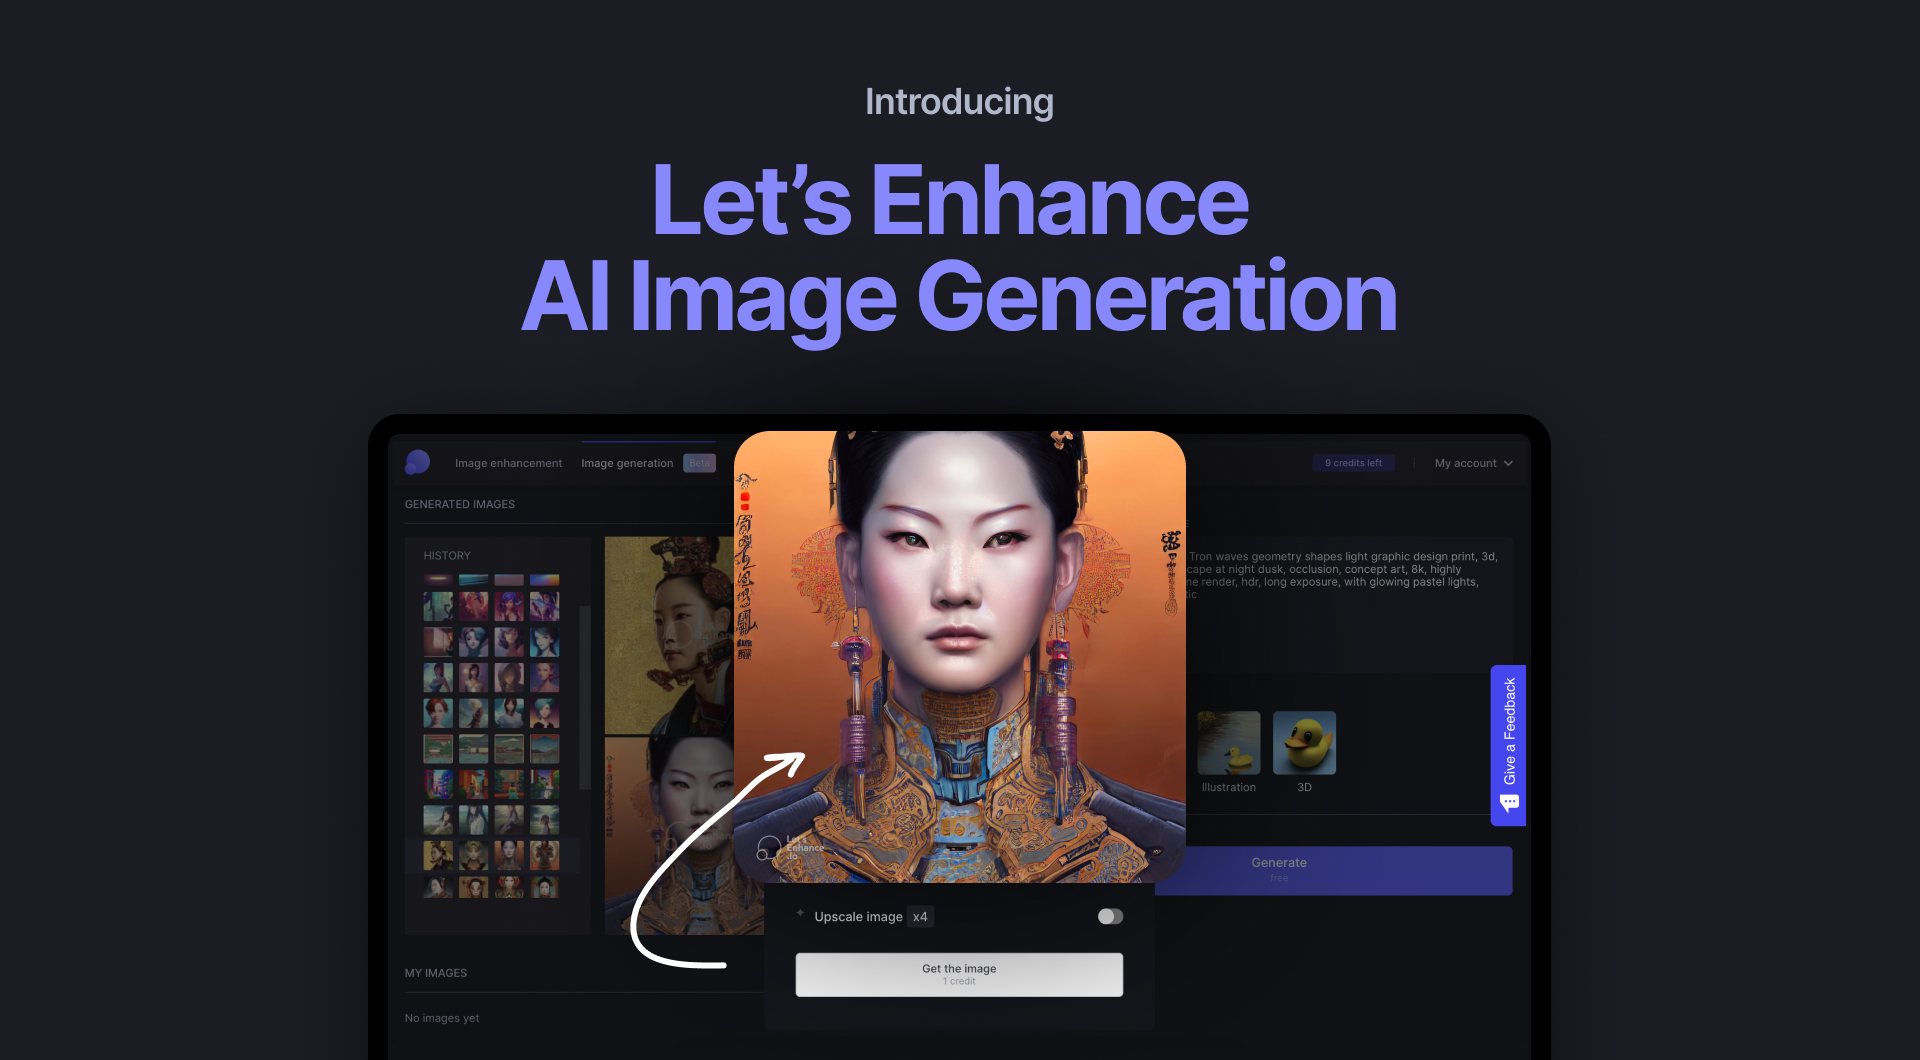
Generate high-quality content
Track keyword rankings,
Please provide a few details here and we will respond to your request.
By proceeding, you agree to our Terms of use and confirm you have read our Privacy and Cookies Statement.